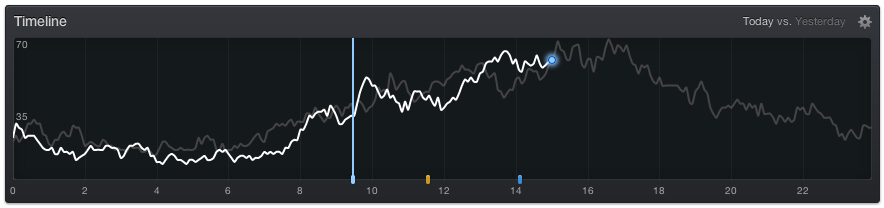
Introduced earlier this year Timeline takes centre stage on every GoSquared Dashboard, offering unique insight into a sites current and past traffic in a single easy to use widget. Recently we quietly pushed out some tweaks to Timeline to make it even more useful with the functionality to compare ‘this week so far to last week’, ‘Today vs the same day last week’ and the original ‘Today vs Yesterday’. These useful insights give Timeline the ability to compare what’s happening right now on your site and give it the context of past data.
Since day one Timeline has shown notifications about traffic spikes and dips plotted on the graph of today’s traffic but what use are these spikes in traffic if it’s not clear what influenced them?
Today we’re taking Timeline to the next level and enabling you to plot milestones on top of your traffic data — showing you the effect your activities outside of your website are having on traffic.
How does it work?
Milestone plotting on Timeline uses RSS feeds making the possibilities almost endless. Adding an RSS feed is simple and all that’s needed is a valid RSS feed URL. Here’s just a few examples of what we’ve been using in house to show off the power of this new Timeline feature:
Blog Posts
The most obvious use case for milestones is plotting blog posts on the Timeline. Simply add the RSS feed for a blog and as soon as the feed is updated a milestone will appear on the Timeline and from that point the chart will begin to rise. Applied across a whole week this gives real insight into what effect certain posts have made over traffic levels compared to others.
Structures of RSS feed URLs will vary but here’s what an unmodified WordPress blog feed URL would look like:
http://www.URLofwebsite.com/feed
Twitter Integration
Getting an RSS feed for a Twitter account isn’t as easy as you’d expect and unfortunately not very reliable either, here’s a little guide to some ways to get an RSS feed of your Twitter account (replace %USERNAME% with Twitter username minus the @ symbol).
URL for RSS feed of Twitter account including @replies:
http://api.twitter.com/1/statuses/user_timeline.rss?screen_name=%USERNAME%
RSS feed for Twitter account minus @replies:
http://pipes.yahoo.com/pipes/pipe.run?_id=94deb73d5821d47b8d4cea719cf49ba7&_render=rss&Username=%USERNAME%
RSS feed of Favourites for a Twitter account:
http://twitter.com/favorites/%USERNAME%.rss
If you want to search for a hashtag then use the following URL (replacing the bit after %23 with the word):
http://search.twitter.com/search.atom?q=search%23hashtag
Email Campaigns
Email campaigns are a fantastic way to reach out to customer bases both large and small. A service like Mailchimp makes creating and sending email campaigns a cinch. Once sent Mailchimp is also great at tracking click throughs from links. Now using Timeline it’s possible to see the effect that email campaigns have on traffic to your site in real-time.
Mailchimp offers an RSS feed of email campaigns which would simply place them on Timeline right before that deluge of traffic comes flooding in from the email.
Web Development
All of the above examples show how traffic is increased by sending out a tweet or email campaign but sometimes changes can be made that have the opposite effect. Let’s say someone on your development team has deployed a number of changes to the website which breaks some pages — such a change would see a drop in traffic.
Timeline would immediately begin plotting this drop in traffic, maybe even issuing an alert bringing it to your attention by working out what caused the break in the first place may take a while to track down. But now with Timeline milestone plotting changes made to code repositories can be logged right onto your traffic making tracking down the changes super easy.
The correct URL for a private Github repository is as follows:
https://github.com/username/repository_name/commits/branch_name.atom?login=login&token=token
See it in action
What do you think?
Every day we hear great ideas from our customers and it’s these ideas that turn into awesome features like milestones on Timeline. So if you’re really hankering for something that you feel needs to be in Dashboard then be sure to let us know. You can contact us via Twitter or email.