
We need real-time data insights because we run a live trading site. Real-time data enables us to manage the site proactively … as opposed to taking a reactive approach.
This post launches our series of featured customer case studies. I sat down with Corinna Herbst from peer to peer betting exchange Smarkets to talk about their business, what makes them unique and how her team uses analytics.
What is the story of Smarkets?
Smarkets was founded in 2008 and we launched the first live product in 2010. Smarkets is a sports betting exchange. The product is a high volume, low transaction cost platform where people bet on the outcome of sports events.
The founder Jason Trost was originally working as a financial trader in Chicago. He came across a site that offered trading on election outcomes and the NFL. Jason was really interested in exploring financial trading on things like politics and sports —not just on currency or financial outcomes.

But that site had a clunky user experience, it felt counterintuitive and he wanted to build a better way. Jason moved to London with his cofounder Hunter and they started coding the platform. Our approach to sports trading is from a financial perspective versus our competitors who come to the problem from a gambling background. Smarkets is like having the NASDAQ for trading outcomes of sports events.
What do your customers really love about Smarkets?
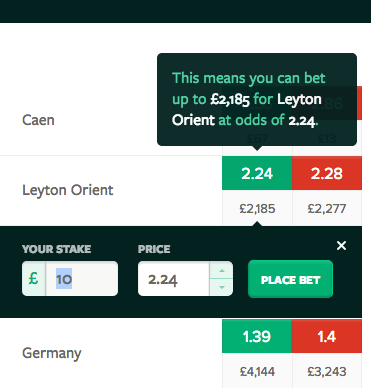
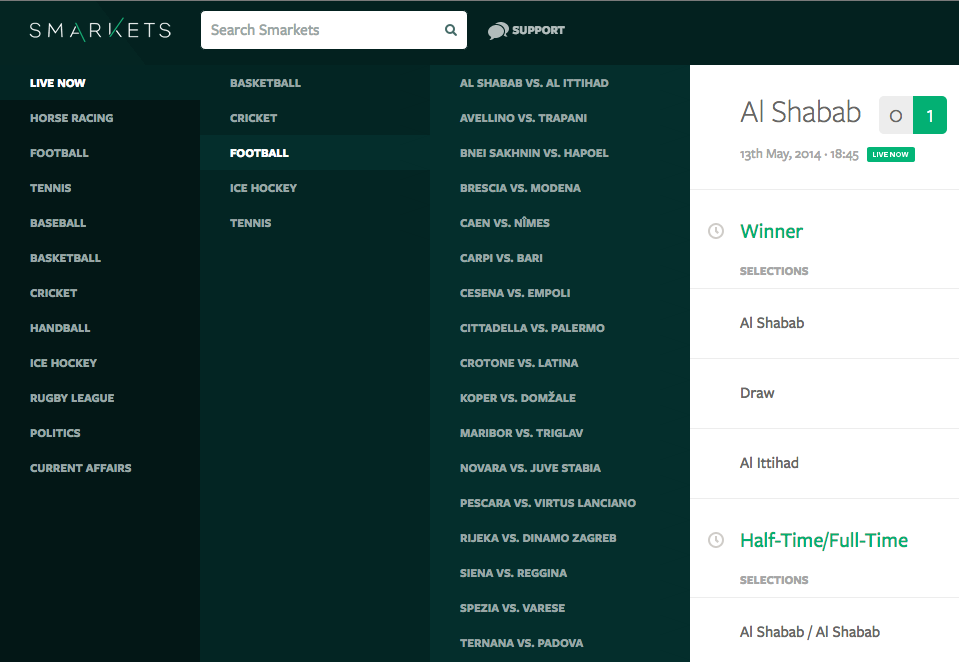
Our users value the clear layout and design of Smarkets, and with that the journey through the site. It’s things like being able to place a bet straight from the homepage without the need for multiple clicks to go into a market page. There’s a lot of shortcuts in it —you can trade quite effectively and quickly. Another big bonus is the pricing. Customers think our 2% flat commission combined with very competitive odds is great compared to other betting sites.

When you were first beginning to get traction and lots of users, what did you want to understand about them?
In the beginning —and it still is now— the key question for us was what pages are our customers looking at and what markets are most popular with them. We see trades coming through after someone’s placed a bet but without analytics it’s very difficult to know what page they are on or what market they’re looking at. We want to know what events are popular. We care about where our users come from in terms of geography —where they physically are— and what sites are referring them to Smarkets.
How do you convert users into returning visitors and incentivise them to keep coming back?
We engage with users through social media channels, we have a regular newsletter and we’re always engaging with users around new features. We’re a development heavy company —we’re a tech startup— and we’re constantly releasing new features. We hold bi-annual open house events at our offices and Jason has gone out to Liverpool, Manchester and Birmingham to meet users.
It’s intuitive and a great overview.
How did you first get started with GoSquared?
We had met the team at White Bear Yard. We were attracted by the interface. In terms of design it was really nice —it’s intuitive and a great overview. We have the GoSquared dashboard on a large screen on the wall of the office alongside monitors showing live performance of the platform.
Why do you have GoSquared on the wall?
Because it is real-time. All our screens on the wall show real-time data so GoSquared fits in nicely. We get a sense of what’s going on, where the traffic is coming from, what devices are people using and how many people are looking at what pages. On GoSquared, we can see busy times. We see patterns of behaviour by time of day and days of the week very clearly visualised.
It has to be real-time because we’re a live trading site.
Why is real-time data important for your business?
It has to be real-time because we’re a live trading site. It’s no good getting data days later in arrears because then we’d be very reactive rather than proactive.
When our developers are scheduling resources or we’re looking at site performance, it’s really important to see how many users are on which page or which market now. We use GoSquared to see where the traffic is concentrated. We need to know where to allocate tech resource —like capacity or memory— so it’s really useful for doing that accurately.
And what does the future hold for Smarkets?
In the next six months, the World Cup in Rio is going to be huge for our business. We are working on partnership deals for that. We keep developing the product. We launched an Android app in the last quarter and we’re working on an iOS app. So there’s a lot happening in 2014.
Background
As an exchange, Smarkets facilitates peer-to-peer betting where users set their own odds and bet against each other. Smarkets’ focus on superior user experience and honest, transparent trading enables the platform to challenge established competitors. Smarkets monitors activity in real-time across its website and markets. The greatest challenge they face with analytics is having an accurate real-time picture of how many users are on the site and which event pages are most popular with visitors.
Results
- GoSquared clearly visualises demand so the rest of the business can react. Web performance sits side by side with exchange activity.
- The whole team sees the dashboard on a big screen in the office.
- GoSquared helps Smarkets allocate technical resources and timetable support.
Corinna Herbst is Head of Business Operations at Smarkets.
Start a trial to see what real-time data can do for your business