We’re excited to announce GoSquared is one of the first to integrate with Klipfolio’s new Klip Gallery.
Klipfolio is one of the most powerful and flexible dashboarding tools out there. You can take any API or CSV file and build custom visualisations on top of it. To help customers make the most of their data, we’ve been working with Klipfolio to bring several pre-made Klips that focus on the key metrics for your business. Below are just a few of the ones that we use internally:

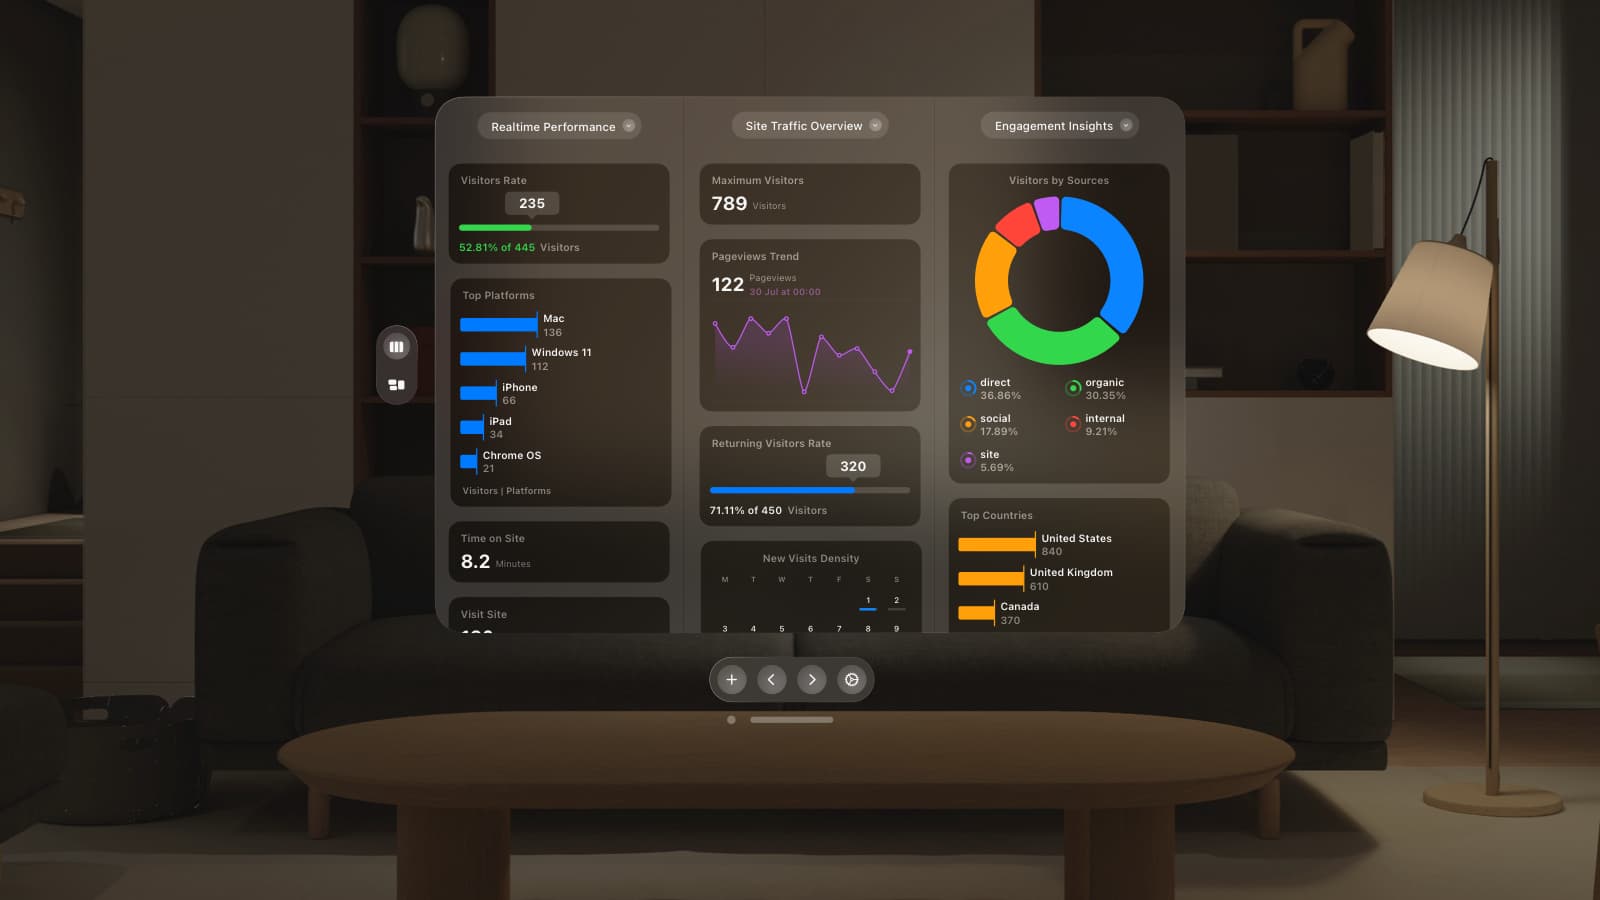
Real-time dashboards are quickly becoming one of the de facto channels of communicating information throughout a business. Why? We live in an age where there is an overabundance of information which can quickly become noise. By having dashboards that focus on the key metrics for that team it allows them focus on what is important right now. Since the dashboards are real-time, everyone is working off the same data, allowing them to spot trends and make data-informed decisions. The GoSquared Klipfolio integration makes this a breeze.

One of the dashboards in the GoSquared office using Klipfolio.
Just the starting point
The GoSquared Klips are only just the beginning. Think of them as templates on which to build your own custom visualisations that matter to your unique business needs. Once you’ve added a GoSquared Klip to your dashboard just hit the settings icon in the top right to customise them further:

Within a matter of seconds you can add in variable colour ranges based upon different traffic levels. Switch up graphs to display the data on either a bar chart or a dial. You can even add in 3rd party data to compliment the GoSquared data and set targets as well.
Have a bit of fun
Okay, this might not be the most useful visualisation but it’s a bit of fun and a good demonstration of the flexibility of using the GoSquared Klipfolio integration:

Who wouldn’t want to represent their key metrics with emoji? This is the future.
Access even more data with the API
The GoSquared Now, Trends and Ecommerce Analytics dashboards are built on exactly the same APIs that are available publicly. In fact there’s even more data available from the API and you can even use our demo data to test the responses straight away.
Getting started
If you’re already a Klipfolio customer, just log in and head to the new Klip Gallery. Click on “GoSquared”, pick a metric and then enter a GoSquared API Key and Project Token. It’s as simple as that. There is also a Klipfolio support article on setting up GoSquared should you have any problems.

There’s also a 14 day free trial of Klipfolio. If you’re new to GoSquared, be sure to make use of our new Free Tier (no credit card required) so there’s never been a better time to get your team on the same page making data-informed decisions.