

When building a SaaS product, it can be so easy to get stuck in an ivory-tower.
When this happens, SaaS companies risk building products which don’t align with their user’s needs. They might iterate on the wrong feature developments; adding features users do not want or missing out on the features users really need.
This leads to poor customer satisfaction, reduced referral rates and higher churn. All of which is like kryptonite to your bottom line.
But so much of this can be avoided, all you need is a diligent respect for User Experience Analytics.
User Experience Analytics provides an accurate way to step into your customers’ shoes.
Through UX Analytics, you can see your SaaS product from your users’ eyes; understand exactly how they interact with it, what areas they find value in, and what areas cause obstacles on their journey.
All of this enables you and your Product team to make informed decisions on which changes to make to your product; ensuring your service remains aligned with your end-users’ needs at all times.
Two types of User Experience Analytics

UX analytics can be qualitative or quantitative.
Qualitative measures user behaviour, outside of the data & numbers. It is more concerned about the ‘why’ behind user actions, rather than the ‘what’ or ‘how’. It is best measured through session recordings, surveys or focus groups.
Quantitative measures the data; the hard facts. It focuses on the ‘what’. Which link did users click? How many times in a session did they click it? Which channel did they originally arrive from?
In order to gain a properly balanced understanding of how users interact with your SaaS product or App, you should look to use a mixture of User Experience Analytics data. That way, you gain both qualitative and quantitative data; understanding both the ‘how’ and the ‘why’ behind your users’ interaction with your platform.
What are the best UX Analytics tools on the market?
User Experience Analytics – GoSquared
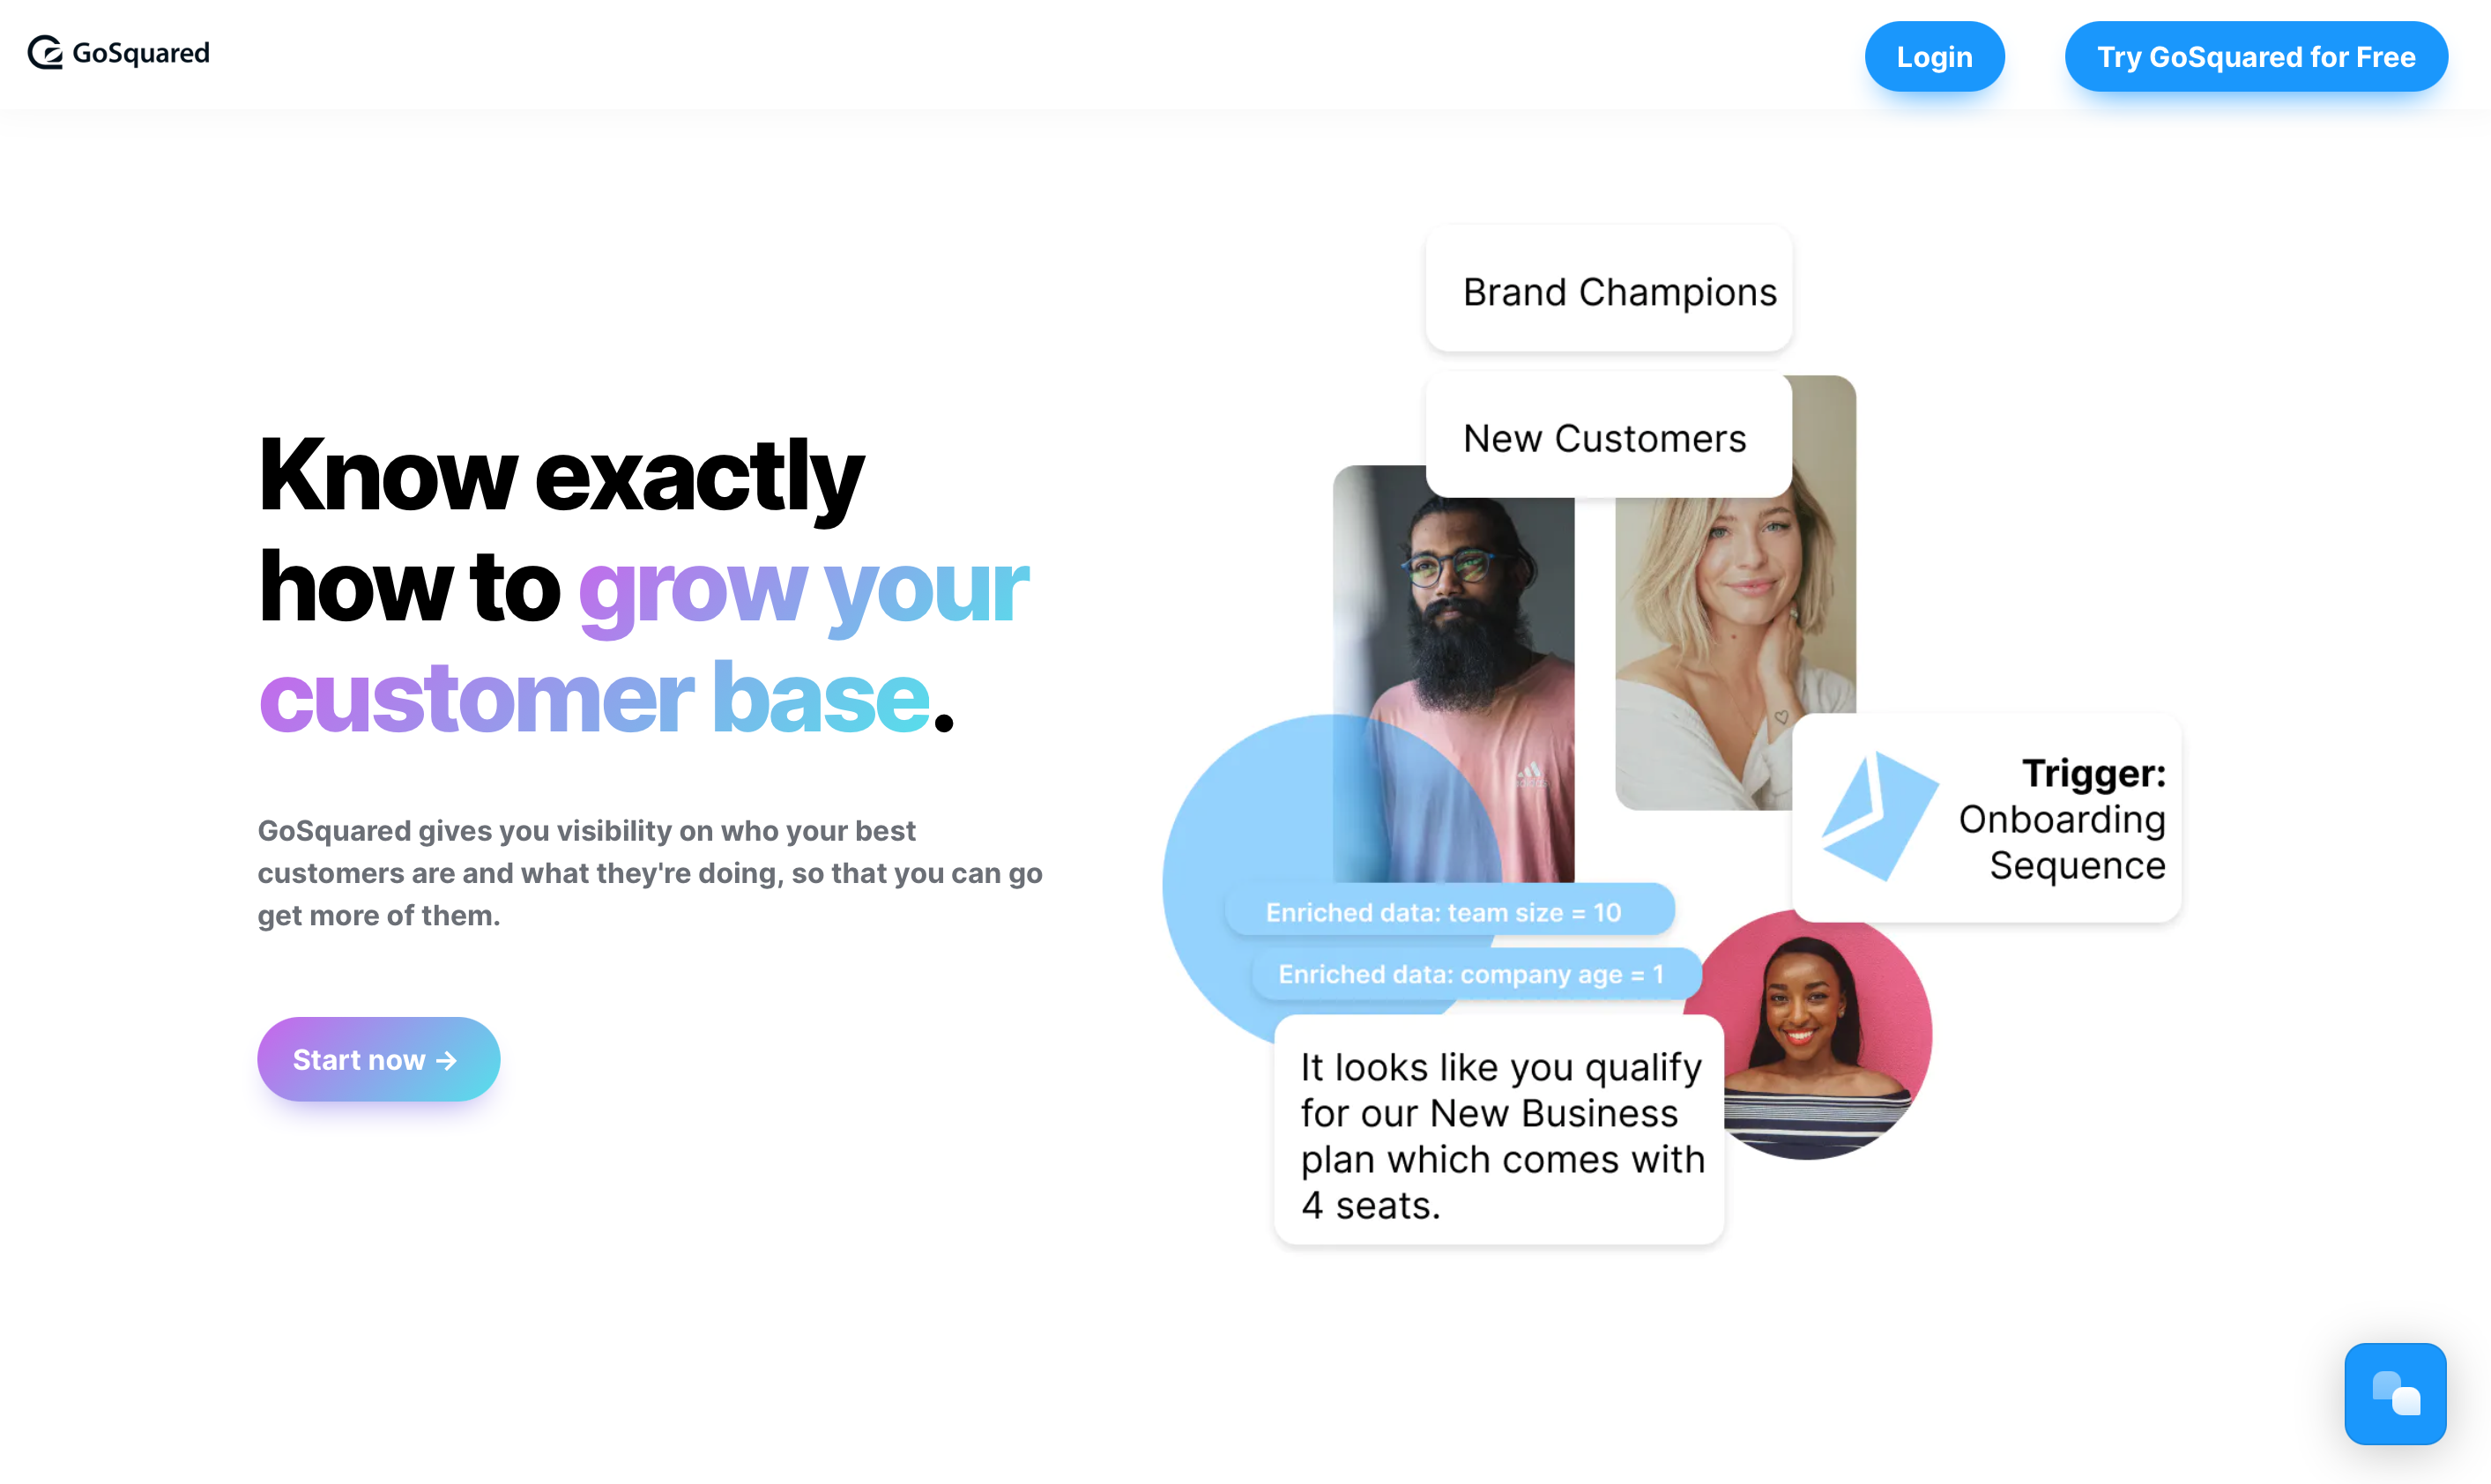
GoSquared’s People Analytics offers highly-detailed, real-time insight into your user segments.
GoSquared provides both an overview of your entire user base and the flexibility of splitting your users into targeted segments. These segments, called Smart Groups, help you understand exactly how different parts of your user base interact with your product. Want to know how company directors engage with your platform, in comparison to sales agents? Use the ‘company position’ filter to split out your users into the relevant Smart Groups.
You can even drill all the way down to individual user journeys. With GoSquared’s real-time analytics, you can understand the exact steps the individual takes in a specific session. Which pages did they click through? Which events did they trigger? Did they activate the latest feature update? All these questions can be answered in People Analytics.
User Experience Heatmaps – Hotjar
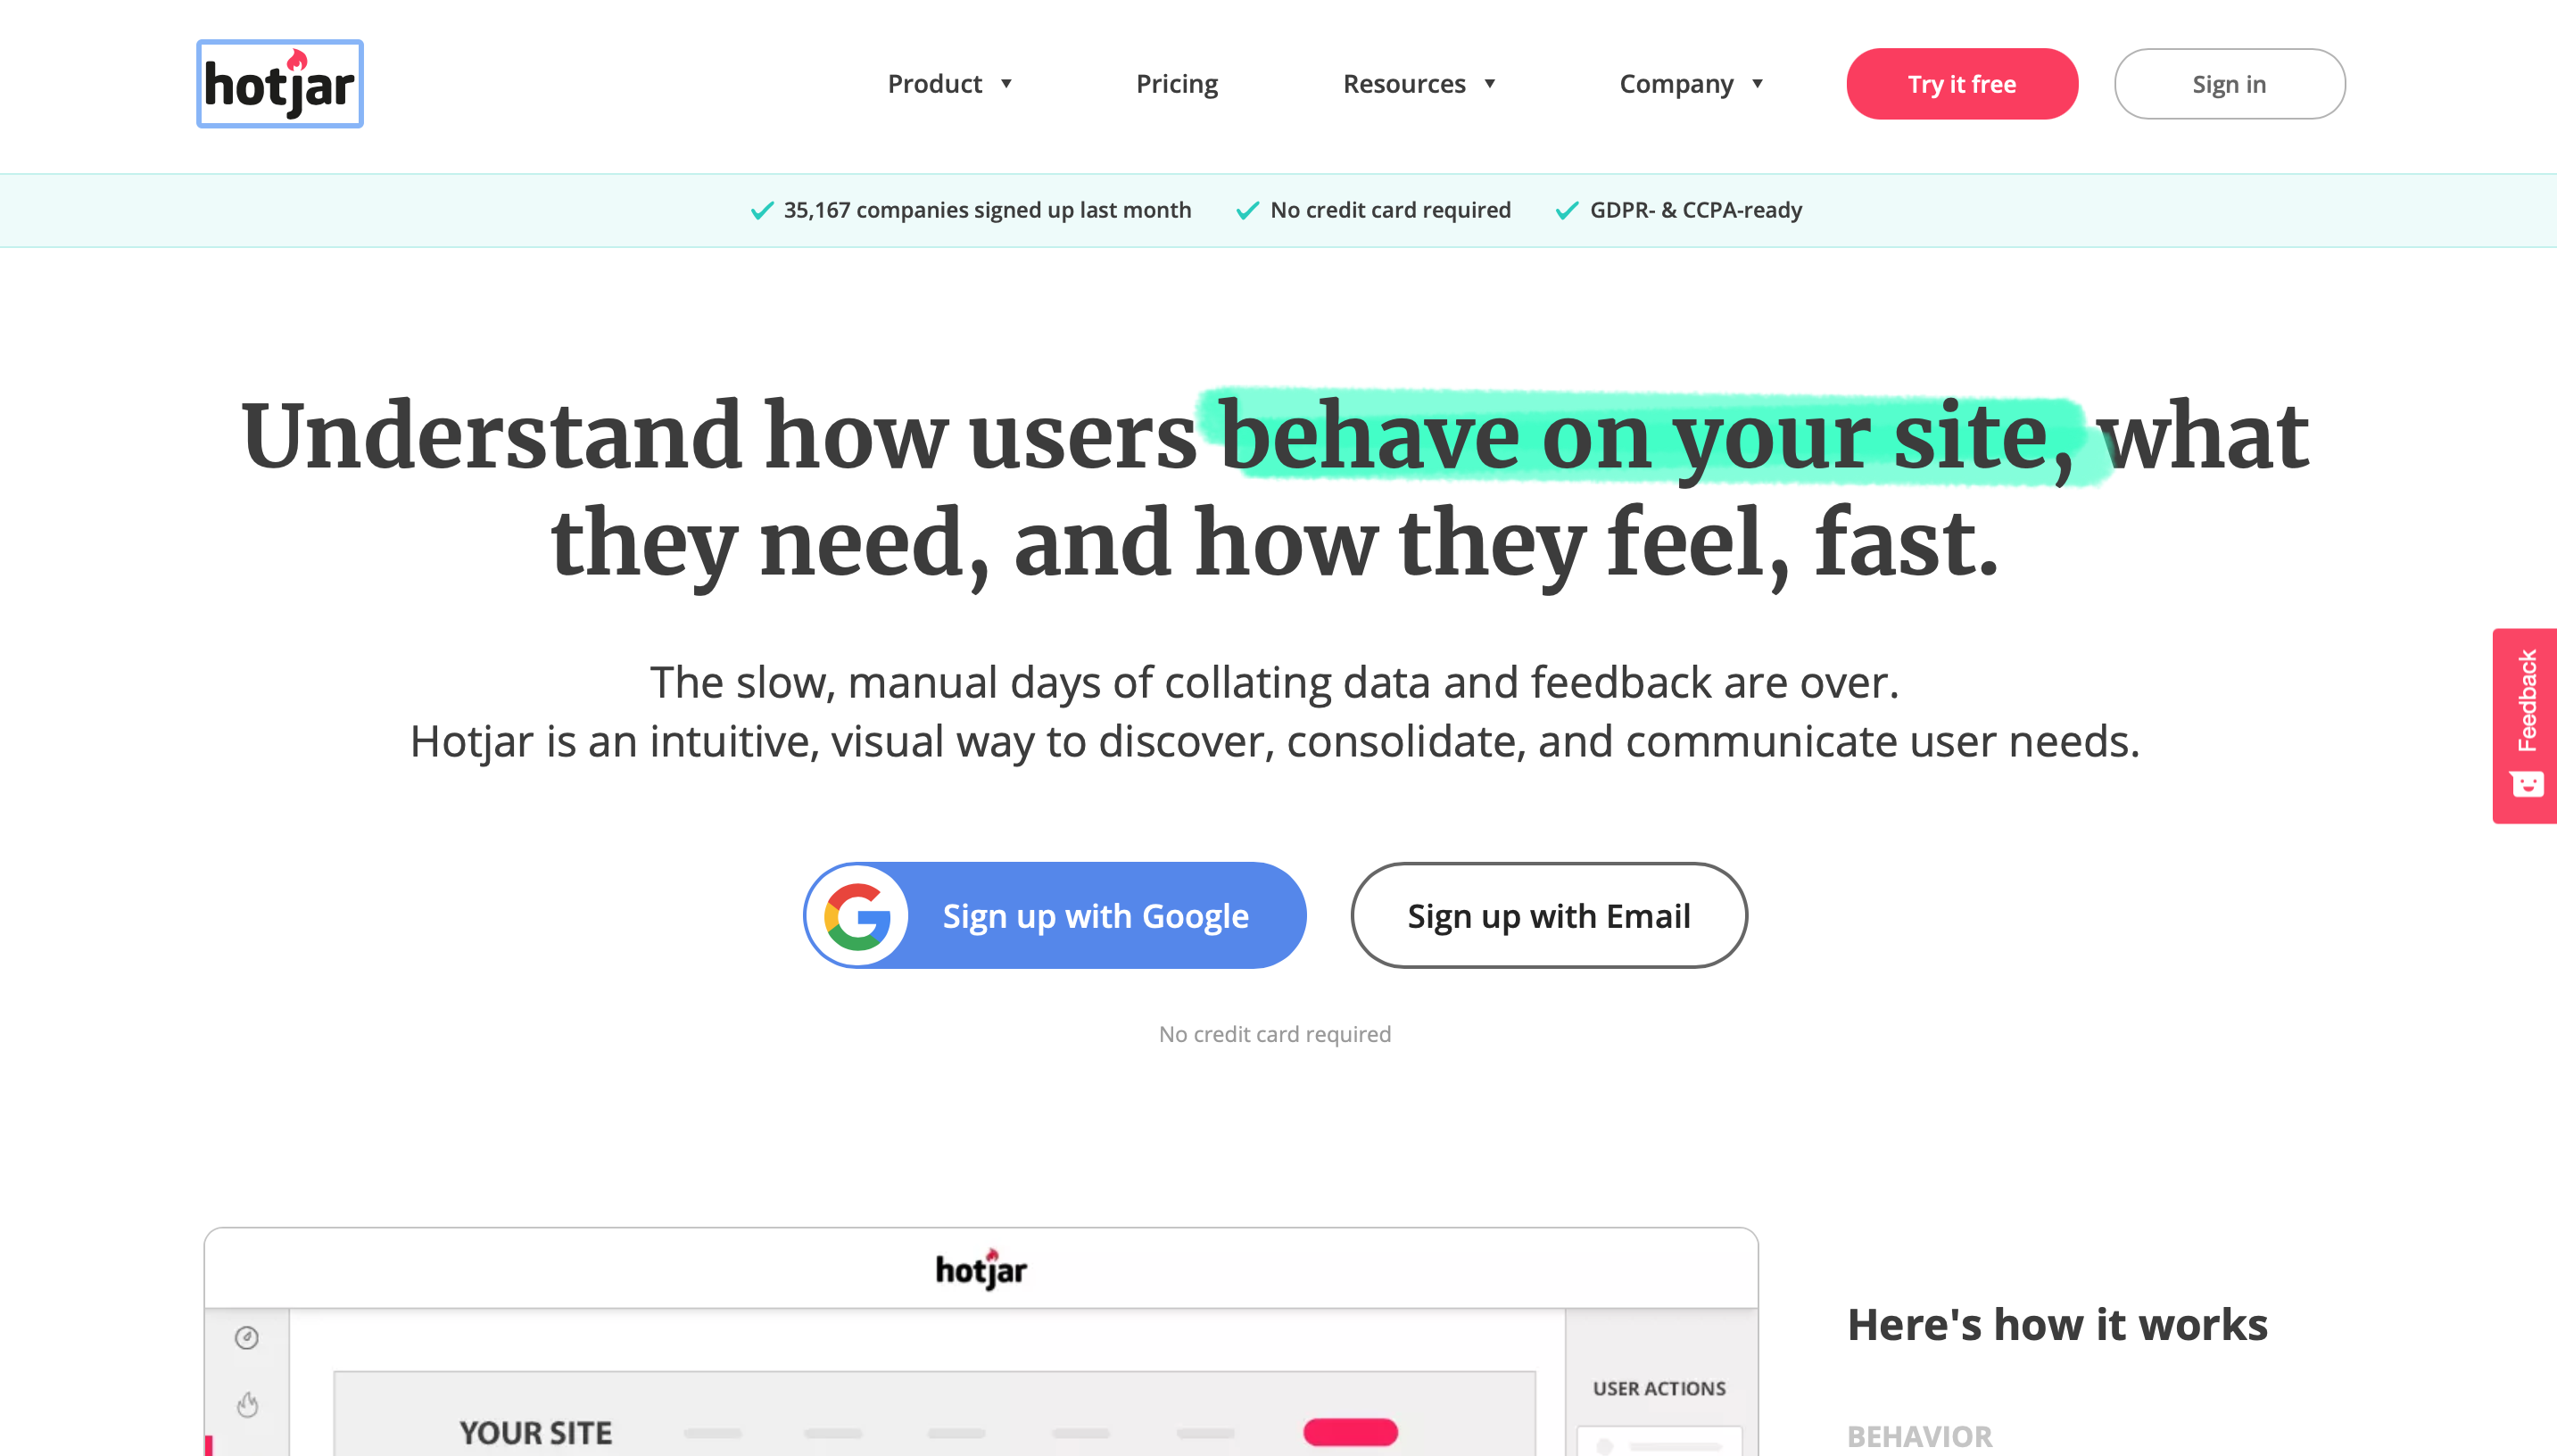
Hotjar is a great tool for qualitative data on user journeys throughout your product. At a glance, you can understand exactly which areas of specific pages see the highest number of clicks. Hotjar provides colour gradients, with red indicating high levels of click activity, and green or blue showing lower levels.
Hotjar is particularly useful if you are running A/B tests on call to action landing pages. Thanks to the heat maps, you can understand which pages see higher click activity on the CTA, and prioritise which versions to keep and which need improving.
User Experience Surveys – Delighted

Tracking your users’ interactions through quantitative data and clicks is invaluable. But nothing quite gives you insight into your customers’ mind like giving them the opportunity to express their feedback in their own words. ‘Delighted‘ offers a Net Promoter Score survey platform; allowing you to understand exactly how your users rate your product, as well as the feedback they offer to improve it.
NPS platforms like Delighted work best when surveys are triggered ‘in-app’. This means users will receive the surveys when they are actively engaged with your product. This ensures their feedback is as accurate and up-to-date as possible. Users will rate your product on a score of 1-10, and then be offered the opportunity to explain the reasoning behind their score.
User Experience Playback videos – UXCam
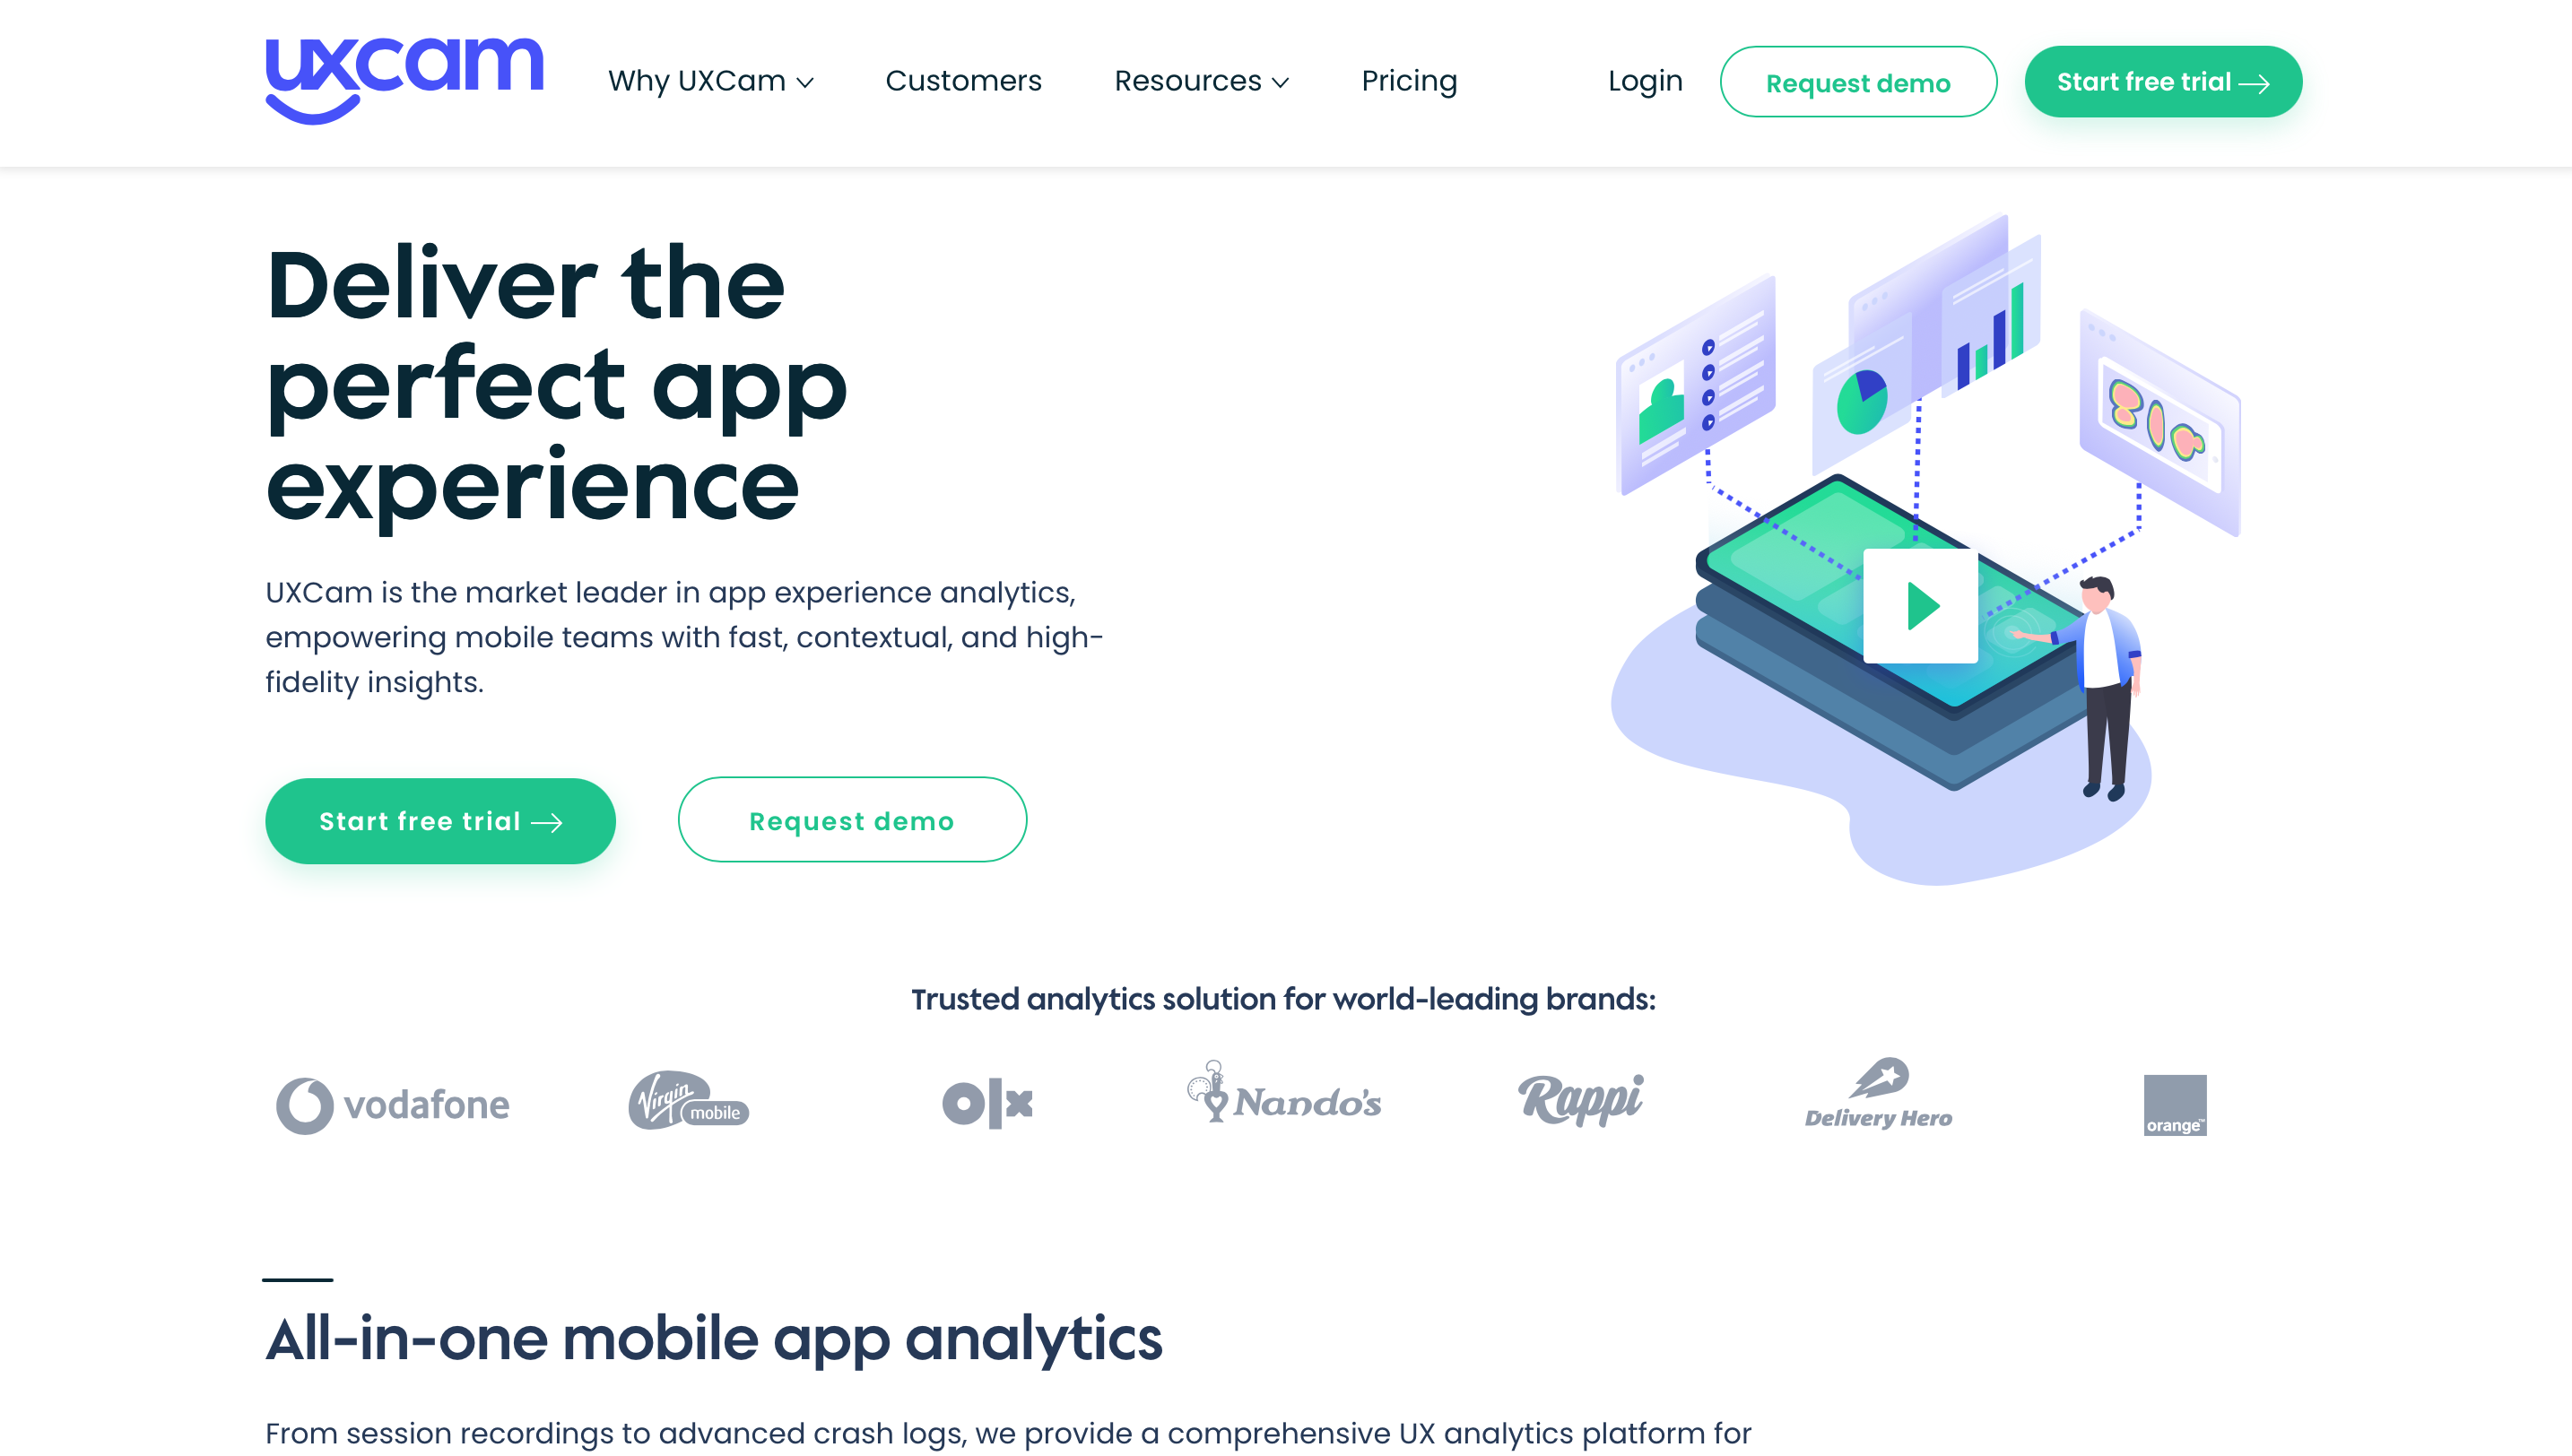
Playback videos, such as UXCam, are a form of visual feedback tool. UXCam records user interactions with your product, as they navigate their way through pre-defined journeys. This works particularly well for Apps which include checkout-page flows. UXCam’s recordings can pinpoint exact areas where users are experiencing friction, and therefore dropping off before completing a transaction.
By implementing the lessons from playbook videos, Product teams can conduct informed iterations on the platform to remove these sources of friction. As a result, they are likely to see an uptick in successful conversions, and a decrease in checkout drop-offs.
User Experience User Feedback – UserTesting

The earliest forms of user feedback involved focus groups. Companies would invite participants into rooms in their office, and take time to observe the participants interacting with their products. In the modern era, this form of user experience feedback still offers high value. Platforms like User Testing video-record users as they engage with platforms and products. This provides visual feedback; observing user facial or body language reactions, as well as detailed context from the users narrating their experiences out loud.
Creating customer centric products starts with understanding experience.
For any SaaS teams who want to create truly client-centric products, deploying user experience analytics tools is a non-negotiable. The most accurate user experience feedback will be a mixture of both quantitative and qualitative data; so you & your team understand both the how & the why of user interaction with your SaaS product. This data can then be used to make the right iterations to the platform, and ensure it remains aligned with your customers’ needs.