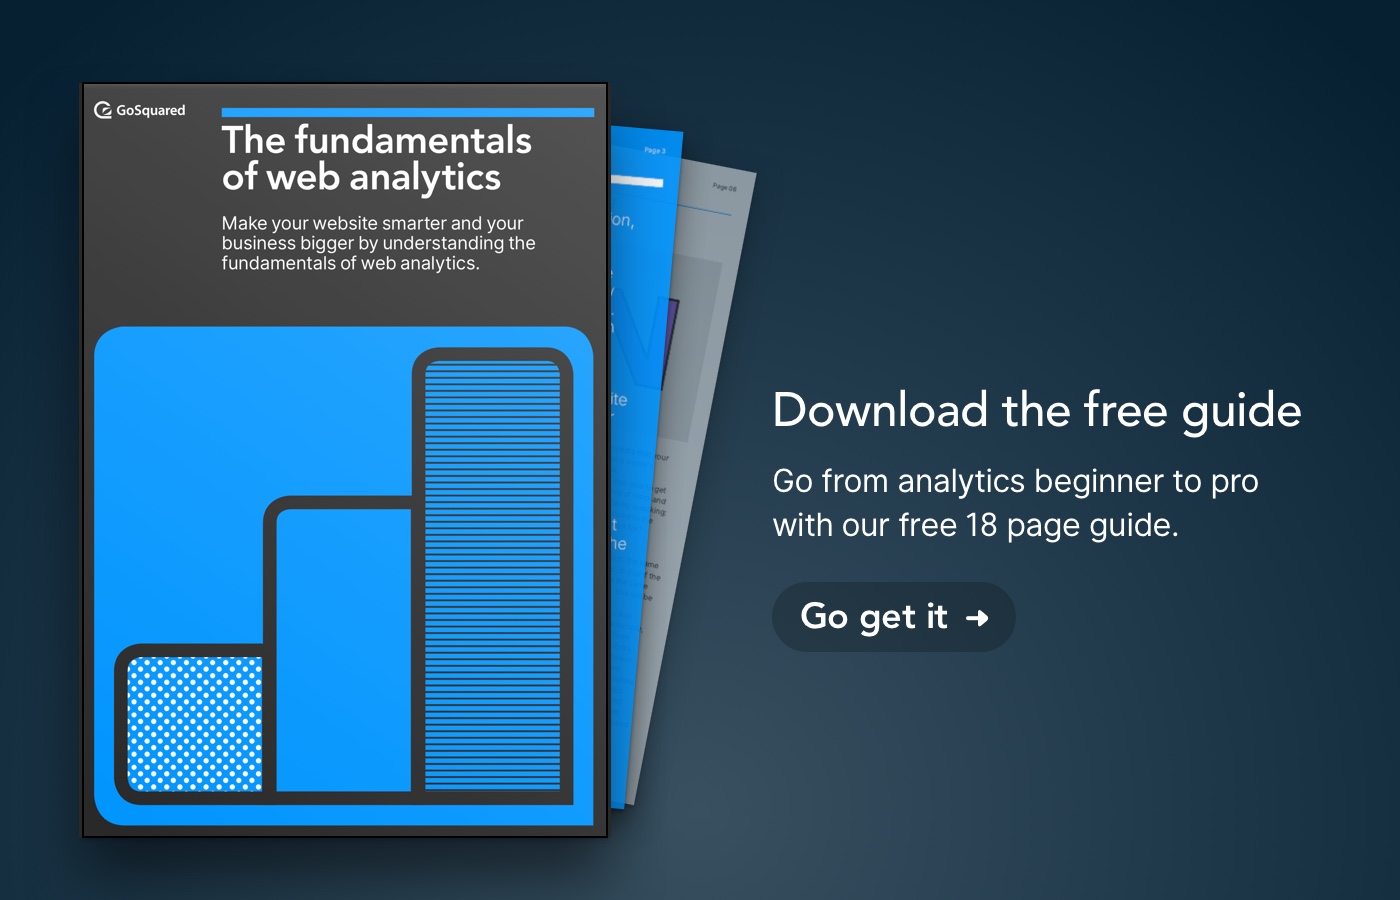
Hold on! Don’t you want to read the fully designed downloadable version of this piece with a bonus FAQ section? It’s free to download.
If you are new to web analytics and want to understand more about how it works then, welcome – you’ve come to the right place.
Web Analytics is a broad field, and at first, it can all seem a bit like sorcery. How exactly can your website tell where someone has come from, if they’ve been here before, and even, who they are?
There’s a huge array of concepts and terms to wrap your head around: pageviews, visits, visitors, unique visitors, new/returning/landing pageviews, bounce rates – the list goes on.
In this guide, we will walk through the basics of web analytics, in plain English, and help to get you up and running straight away making the most of your website.
If you want somewhere to put your new skills to use you can download our free analytics tool. We designed it specifically for people who have busy jobs and a lot to do – it’s simple to use and quick to show results.
Why do I need web analytics?

Web analytics is defined as: the collection, reporting, and analysis of website data.
In short, web analytics allows you to see how your website is performing and how people are acting whilst on your website. What’s important is what you can do with this knowledge.
Why is this useful?
Making very small changes on your website can have a massive impact on the number of people who visit your site and buy your product or service.
Analytics is how you find out what to change, how to change it, and whether your changes are working. But to get to that stage, you need to know how to work with the fundamentals.
That’s what this guide is all about. Over the next few pages we will get you to a stage where you can confidently analyse your own website data and begin to make better informed, stronger decisions.
Let’s get started. Remember you can get our free analytics tool with only a few clicks, take a couple of minutes to add it to your site right now and follow along with our guide.
Coming up:
-
- How does all this actually work?
A quick introduction to what makes analytics possible.
-
- Which analytics tool should I choose?
There are a load of great options, which one is best for you?
-
- Get to grips with the key analytics metrics.
What is a pageview?
What is a visitor?
What is a visit
-
- Have you been here before?
Why returning visitors is an important metric for site performance
-
- Knock, knock – who’s there?
A more detailed look at exactly who is on your site, and what they’re doing.
-
- What’s up with bounce rates?
What does it mean when someone comes to your website, only to leave straight away?
-
- Where did you come from?
Understand how your visitors found your site.
-
- How did you get here?
An introduction to traffic driving marketing campaigns.
-
- Your website’s front door
Your landing page is the first thing a visitor sees.
-
- See you soon!
We look at how and where people leave your website
-
- What are you using?
The devices and browsers that your visitors are using helps you to solve problems faster.
-
- Getting a little closer
Start understanding the specific actions your visitors take
- Congratulations!
How is web traffic measured?

First things first: how does all this actually work?
When visitors go to your site, they are loading webpages up from your webserver to view in their browser. But how do we monitor this activity? How do we measure how much your web pages are viewed and how many people come to your site?
For this, you will install a web analytics tool on your website. These days there are lots to choose from. It used to be the case that you had to install complicated software on your web server to interpret your traffic logs and generate your stats. This was a lot of work, drained your web server resources and frequently broke.
Lucky for us, there are now analytics tools which take care of all the heavy lifting and can be installed by placing a small piece of code on your website.
We make our own analytics tool: GoSquared Analytics.
Of course, we aren’t the only tool out there. There are free and paid tools that all do present the data in a slightly different way, and might even track different metrics. But at the end of the day, they all tell you what’s going on underneath the hood of your site.
Which analytics tool should I choose?

To understand the data you collect from your website, first things first you’re going to need a web analytics tool.
There’s a lot of choices here. Google Analytics tends to be the default for most people, because it is free and can offer an incredible amount of detail for power users. However, there’s a huge amount of complex detail that can be confusing when you’re starting out.
We originally built GoSquared Analytics to be a faster, simpler alternative to Google Analytics, which is easier to use and offers more accurate real-time data.
Most of our customers choose to use both – they are not mutually exclusive – to get the power of Google’s number crunching expertise combined with the speed and ease of GoSquared.
When weighing up what analytics tools to use (and you can use more than one!) – think about the following:
- The metrics you know you’ll need to track from day one.
- The opportunity to get more advanced insights in the future.
- The impact of the analytics script or tag on the page speed of your website.
- The vendor’s approach to privacy and data protection.
- The ease of use of the tool so your team can make use of the insights.
Of course, we are entirely un-biased and would whole-heartedly recommend that you give GoSquared Analytics a try – sign up for free over on our site.
Regardless of which analytics platform you choose, there are some basics you’ll want to know to make the best use of it.
Getting to grips with key analytics metrics
What is a “Pageview”?

A pageview is, as the name suggests, the number of times your website’s pages have been viewed by people visiting your site. Whenever someone loads up your page in their web browser, or refreshes the page, or moves to another page, a pageview is counted.
The pageview is one of the simplest and most important metrics in web analytics, and it is good for a quick overview of traffic volume and activity.
Note that the number of pageviews is not the same as number of people viewing your page – we’ll get into how you can see that a bit later.
Why is this useful?
If you are in a scenario, perhaps where your goals or targets are aligned to traffic volume, then this is, of course, an important metric for you to be able to prove yourself or your project. More specifically, knowing which pages are the most viewed is particularly useful for websites where you are always adding and updating content.
By learning what your top content is, and connecting the dots to find patterns between them, you are able to begin focusing on certain topics that you know resonate with your audience.
Content creation becomes less of a guessing game and more attuned to the needs and wants of your customers.
Nice to meet you! What is a “visitor”?

Measuring the number of “visitors” is an attempt at measuring how many different individual people have visited your website. In reality, it is never a completely accurate measure, but is usually a reasonable estimate.
This number is really a count of the number of different devices (web browsers on computers, phones, tablets etc) that have visited your site. Since someone could visit your site on their computer, and then later on their phone, they would here be counted as two people – even though it was actually the same person.
Nonetheless, it is a better metric than pageviews at estimating the overall size of your audience.
It is useful to understand the various ways this metric can be inaccurate. Say if that person also uses two web browsers on their computer, and they visit your site in both browsers, they would now be counted as 3 total “visitors”: one for each of their browsers on their computer, and one for the browser on their phone.
Likewise, a public computer in a library or school might have tens or hundreds of people using it, and yet could register as one user because they all came through the same device.
Also, note that this metric can be further affected by cookie settings and web tracking blockers. If the visitor’s browser blocks cookies, they will not be remembered as having visited the site before and so will always be counted as a visitor whenever they view a page. In this scenario the metric is effectively the same as the “pageviews” metric, and can falsely drive up your numbers.
Finally, if the visitor is using a tracking blocker, they will not be counted at all, as the analytics tool would not be allowed to run in their browser.
Why is this useful?
So, this is all to say that the visitor count can give a reasonable estimation of the number of people who came to your site, but it can never give you an exact reading.
Practically this isn’t all that important in the vast majority of situations. This metric is useful to show your audience growth and the growth of web traffic which can be gained from analysing the trends in visitors without worrying about the small percentage of ‘false visitors’.
Come on in! What is a “Visit”?

A visit counts how many distinct browsing sessions there have been on your website. For example, someone visiting the homepage of your site then browses to your about page, then your contact page, and then leaves by closing the tab in their browser. This whole session counts as one visit.
If they were to open a new tab and go back to your site, this would be counted as a separate visit.
The difference to pageviews is that it does not count every time a page is loaded, only the overall session.
Why is this useful?
Again visits provide data to measure the amount of traffic coming into your site at any one time.
Where visits contain more detail is in the ability to map a visitor’s journey through your site. This is invaluable information for your sales, marketing, and product teams. All of these teams are influenced by the way customers actually use and interact with the site. By tracking the start, middle, and end points of a visit provides data that your team can use to optimise a visitor’s experience with your site.
Furthermore, we are also able to get more data on the frequency of visits and the retention of visitors. Plainly speaking: how often does someone come to the site, and how long do they visit for?
Not all visits are equal
The visit metric is susceptible to the same caveats as the “Visitor” metric, in that if the same person visits your site at the same time in two separate browsers, this will be counted as two “Visits”.
Different web analytics tools also measure “visits” differently. For example, Google Analytics will infer a visit from time between pageviews (i.e. if it looks like there has been a long time between two pageviews, then it will count two visits). Whereas GoSquared has accurate real-time session tracking, so it knows when a visitor still has a page open and only counts a visit again once all pages from a previous session have been closed.
Have you been here before?

Another interesting element concerning visitors is whether they are a totally new visitor or if they have been here before. We call these visitors ‘returning visitors’.
Customers and visitors expect more and more personalisation than ever before, and luckily advanced analytical tools make it really easy for us to provide this experience online. By tracking whether a visitor is new or returning you are able to treat them differently.
This is important information for a load of different teams, perhaps most importantly, sales. We’ve written in detail about the importance of context for sales before if you’re interested in taking an in-depth view.
If there are no cookies, there’s no trail
Any visitor who has cookies disabled on their device will be registered as ‘new’. Without this feature enabled it is not possible for any analytics software to remember a returning visitor. However, this is usually a small percentage of visitors whose statistics do not adversely impact the validity of the rest of your collected data.
Knock, knock – who’s there?

By using detailed analytics tools combined with a CRM (customer relationship manager) or Customer Data Hub tool you are able to identify in detail who is visiting your site.
You are able to collate data from different parts of your site on individual customers and on segmented groups of customers that we call Smart Groups.
This can happen in different ways – we can look at people who have visited your site more than once, who have visited certain pages of your site, or who have been customers before.
Why is this useful?
Your sales team will find a lot of value in this information as it allows them to make personalised and tailored approaches to potential customers. Something that we know customers are expecting more and more.
You are able to tell what sort of approach to make, with the context of the data helping you to make informed decisions as to whether its time to make a sale, or to present someone with more information or inspiration.
Furthermore, collecting this detailed information helps you to better understand the demographic of your customer base. This added layer to your customer profiling will help you get closer to your customers and provide them with better products, better content, and better service.
Boing! What’s up with bounce rates?

A bounce is when someone comes to your website and then leaves without visiting any other pages. The majority of analytics tools will measure this as a ‘bounce’ – no matter how long the visitor stayed on the page, and even if your website is a single page site. We have worked hard with our own analytics product to include time as a measurement of bounce rate. This means that with GoSquared Analytics bounces only register when someone very quickly exists your site, but a visit is counted if someone spends a bit of time browsing even just the one page.
The importance of this is clear for single page sites where at worst the lack of time consideration could result in a 100% bounce rate.
By differentiating between bounces and visits where the person lingers on that one page you can begin to understand why someone might be spending a lot of time on that page. If it’s a blog post – this is actually not a bad thing. But if the page is your home page, maybe it’s confusing or doesn’t get the right message across even though it’s clearly of interest to the visitor.
The link between bounce rate and SEO is still unclear, but we can be pretty sure that a high bounce rate has a negative impact on a websites’ performance.
Why is this useful?
When looking at the success of your website the bounce rate is a great way to look into user engagement – and this is why applying a time frame is so important.
The amount of time a user spends engaging with your page is a good indicator of their level of interest in your service or product. Simply put; the lower your site’s bounce rate the more people are enjoying the content you are showing them.
If you are experiencing a very high bounce rate have a look at your most popular pages and see if you can replicate themes from these on to your landing pages.
Where did you come from? A look at traffic sources

In the realm of analytics a ‘source’ is anything that sends people towards your site. By using an analytics tool and something called a UTM parameter you are able to see exactly where your visitors are coming from. We have a whole post on how to understand and use UTM parameters if you want to learn more.
Traffic sources are broadly split into two categories Organic or Paid. Let’s start with Organic as it is generally considered to be the better of the two sources.
Organic Traffic Sources
Organic traffic is considered to be unprompted – the person came across your site naturally, not via any ads or promotions.
1. Search Engines
This source looks at traffic which comes from someone entering a search term and coming across your site naturally. Your SEO will have a huge impact on how often your website shows up in the search results and for what terms – there are hundreds of blogs out there dedicated to helping you master SEO so we won’t get into it here.
2. Backlinks
Another form of organic traffic is through a backlink – simply, a link back to your site from another site. We have included some backlinks here where we have linked to other resources or websites that we think add valuable context or further information that you might find useful. On someone else’s website these links will register the source as right here.
Backlinks are a powerful form of organic traffic because it is sort of the internet’s version of ‘word of mouth’. When someone else links to your site it is usually because they are recommending your product or that they are referring to a piece on valuable content you have produced. This is a great way to build trust with your visitors as they are often coming to you through a website that they trust.
3. Social Media
The organic side of social media is where someone has picked out your site and decided to share it amongst their friends and followers. Again, like backlinking this is a powerful (probably more powerful) form of internet word of mouth.
Paid Traffic Sources
This is considered to be a lesser form of traffic because it wasn’t ‘earned’ in the same way organic traffic is. In theory, organic traffic grows on its own accord, and paid traffic only exists whilst you are pumping money into it.
1. Social Media
Paid ads on social, which sometimes appear as ‘sponsored’ or ‘promoted’, can be a good way to gain more traffic. On most sites they deliberately identify the advertisement in a very subtle way, knowing that people will skim past most things that look very obviously like they are trying to sell you something. However, digital advertising regulations are being refined every month so make sure you stay up to date on the latest rules.
2. Advertising
Advertising on the web comes in many different forms. This could be banner ads, or social media ads, or Google Ads. These are useful tools that can help more people find your site, and you are also able to track their effectiveness through you analytics tools.
Why is this useful?
Knowing where your traffic is coming from is a good way to gauge where you have presence on the internet. You can see whether you are being talked about and what people are saying. Both other businesses and customers will provide interesting insights as to what your most popular content is or in what situations your website comes to mind. You might be surprised. These insights will help you to decide where to spend your marketing budget, and which audience you should be focusing your efforts on.
Sometimes this information isn’t available
It’s important to know that some websites choose to disable this information, also known as ‘referrer information’. What this means is that not all visitors who clicked through from another site will show this as their source. As with a lot of website analytics it’s good to think in trends rather than exact data points as it’s hard for this to be an exact science.
For search engine traffic; it’s rare that a search engine will disclose the search term used to find your site. The information you will see is which search engine was used, and how many visitors came through that route. This is partly why SEO is a bit of a dark art.
How did you get here? What we know about campaigns

Focused efforts in driving traffic to your website are typically referred to ‘campaigns.’ The key metric usually used when measuring your campaigns’ effectiveness is a visit.
By viewing total visits that each campaign has driven to your website, you can easily see which campaigns that you are running are the most effective at driving traffic to your website.
Campaigns could include activities such as email marketing, paid social media ads, or paid search ads. Anything really that includes a link that a user can click on that on that directs them to your website.
In order to track visits from campaigns that you are running, you use a special kind of link often referred to as a ‘campaign url.’ This is just a link to your website with some special parameters at the end, called UTM parameters, that let analytics tools which campaign that visit came from.
For example, the following link would allow you to identify the traffic to ‘www.example.com’ that came from an email newsletter, as part of a ’product launch’ campaign.
https://www.example.com/?utm_source=newsletter&utm_medium=email&utm_campaign=product-launch
Campaigns are an incredibly powerful tool to make sure your marketing efforts are as effective possible. If you’d like to learn more you can check out our in-depth post on UTM parameters and start creating your own campaign url’s with our free campaign url builder.
Your website’s front door. Landing pageview (or “Lands”)

Not everyone arrives on your site via the homepage. Whether it’s from following a link, or by being directed via google many people will enter your site via a different page.
The first page a visitor goes to is called your ‘landing’ pageview. This is really important because there are so many websites that are difficult to navigate around.
For example, if you enter a website via a blog post or guide – like this one – and then decide you’d like to browse other content, or take a look at the team behind the content, it should be incredibly easy to do so.
By using this data to understand the most popular points of entry to your site you can focus you energy on perfecting these pages that you know are getting lots of views.
We have numerous different landing pages on the site depending on what you are looking for. If you just searched for GoSquared then our main homepage would show up for you in your search engine.
If however, you searched ‘GoSquared Analytics’ the first page, or landing page, you would be sent to would be our Analytics Home.

Why is this useful?
Knowing where you visitors enter your site, and how they react to those pages, is a great starting point for creating a more effective website. You can focus your efforts on making these pages as effective as possible – think about your Call to Action buttons, the way your visitor moves around the page, and where you are trying to direct them.
Catch the rebound – getting to grips with exits

When someone exits you site your analytics tool is able to record which page they left from. This can help you to spot faults in your site, and can also be a neutral action – for example someone finishes reading a blog post. People will always leave your site at some point, so exits aren’t necessarily a bad thing. A ‘good’ exit pattern will be spread out across various pages, or be biased towards a page which you know is the end of a customer journey. A ‘bad’ exit pattern will include a high percentage of people not leaving the home page or might be focused on one or two pages.
However, finding the pages where most people leave your site might lead you to uncover inefficiencies. It might be difficult for them to see where to go next. There might be slow load times or something else that’s making them frustrated. If this seems like it could be the case it’s important to work on developing these pages to reduce the number of exits.
What are you using? Devices & browsers

Another thing that your analytics tool will be able to tell you is what devices people use to visit your site. You can see if they are using a desktop/laptop and whether that is a Mac or PC, or whether they are using a mobile device and whether that is a phone or tablet. This helps you to understand how responsive your site needs to be – although nowadays it is always recommended to have a fully responsive website across desktop and mobile devices. This data can be useful in understanding your customer’s behaviour – are they engaging with your site on the go, or whilst at their desks?
To add another layer of detail you can see what browser your audience are using. This can be useful in two main ways.
- To gauge the tech-savviness of your audience. If you have a lot of users using nonstandard browsers it is likely that your audience have an interest in technology and a higher understanding.
- To help diagnose and fix issues with your site that may be browser specific. For example, a page layout that is broken when viewed in Internet Explorer, or a Javascript code that doesn’t work in an old version of Edge.
A little more detail. Learnings from event tracking

An event is what we call an action taken by a visitor within a single page. For example, if you have a product for sale on your page and there is an option to click for more information you can set up an event to be triggered when this button is clicked. Other examples could be someone spending a certain amount of time on the page, scrolling to a specific point, or how much someone clicks.
Tracking events is one of the more complicated aspects of analytics as it requires additional code. You’ll likely need to talk to your developer about adding the tracking into the code or check the help docs on your website building tool.
Events are a really useful analytics tool when you have a site with a lot of options on a single page and want to know how visitors are behaving on that page.
Why is this useful?
Being able to see and track specific actions users are taking on your site is really important in helping you to understand where you are doing well, in terms of design and content, and where might need improvement. It also allows you to build up a picture of the actual customer journey around your site, instead of how you imagine they will move.
In some tools, like GoSquared, you are able to track all the actions of a single visitor across pages but also across events. This information is key as you can see that Bob visited x page, then y page, clicked here, then there, and then didn’t buy… By comparing the data across a large number of visitors you can notice patterns in behaviour and see where people are getting stuck. Knowing this information gives you the opportunity to optimise the design and flow of your site.
Congratulations! You can now speak analytics.

Hopefully, you are now fully versed in the language of web analytics and are ready to look at your own site through fresh eyes. Remember that analytics is not an exact science – although we try to get it as close as possible!
Look at your data as a set of trends and patterns and think outside the box regarding what the data might be telling you about your customers and their habits.
Enjoyed this guide?
Sign up to our newsletter to keep up to date with all our guides and blog content.
Remember that if you’d like the pdf version – yours to keep, for free – you can download it here!
Please get in touch if you have any questions or topic suggestions – we love to hear from you!