When your SaaS product is self-service, you don’t get to sit back, relax and wait for the subscriptions to come pouring in. You need to continually optimize your SaaS website and funnel.
With self-service SaaS, you probably aren’t getting on the phone with every new trial signup, so you need to invest that same energy in your processes and automated communication with users.
In this post, we’re serving up four straight-forward ways to monitor your SaaS marketing and sales metrics to find new revenue-generating opportunities.
Log-in to your favourite website analytics tool, review your dashboard for the info below and take action! We’ll tell you exactly what to do with the information you’re about to uncover so you can increase MRR.
If you don’t currently have a web analytics tool, or if you can’t find the data you want from it, we make our own product which we think is pretty great. Plus – it’s free!
Seeing who is likely to buy your self-service SaaS

With self-service SaaS products, the pricing page is incredibly important.
On this page, customers review your subscription tiers, decide which is the best fit for them, and hit the magic signup button. When they sign up, they might still be skeptical, but they’re at least motivated to trying your product and experiencing the value.
That’s why viewing the pricing page is such an important action. The first time that a potential customer clicks on your pricing page, it may be done very quickly, with low intention to purchase. This is a very common pathway for users to take…scroll down the home page, hit the pricing page and see how expensive the tool is. How many times have you done this same thing yourself?
However, the second, third or fourth time that a potential customer views the pricing page, they’re most likely getting ready to buy. They’re considering which price is the best fit for them, and they might be checking out your pricing against competitors.
A high number of views on the pricing page is one of the best indicators that someone is getting ready to buy.
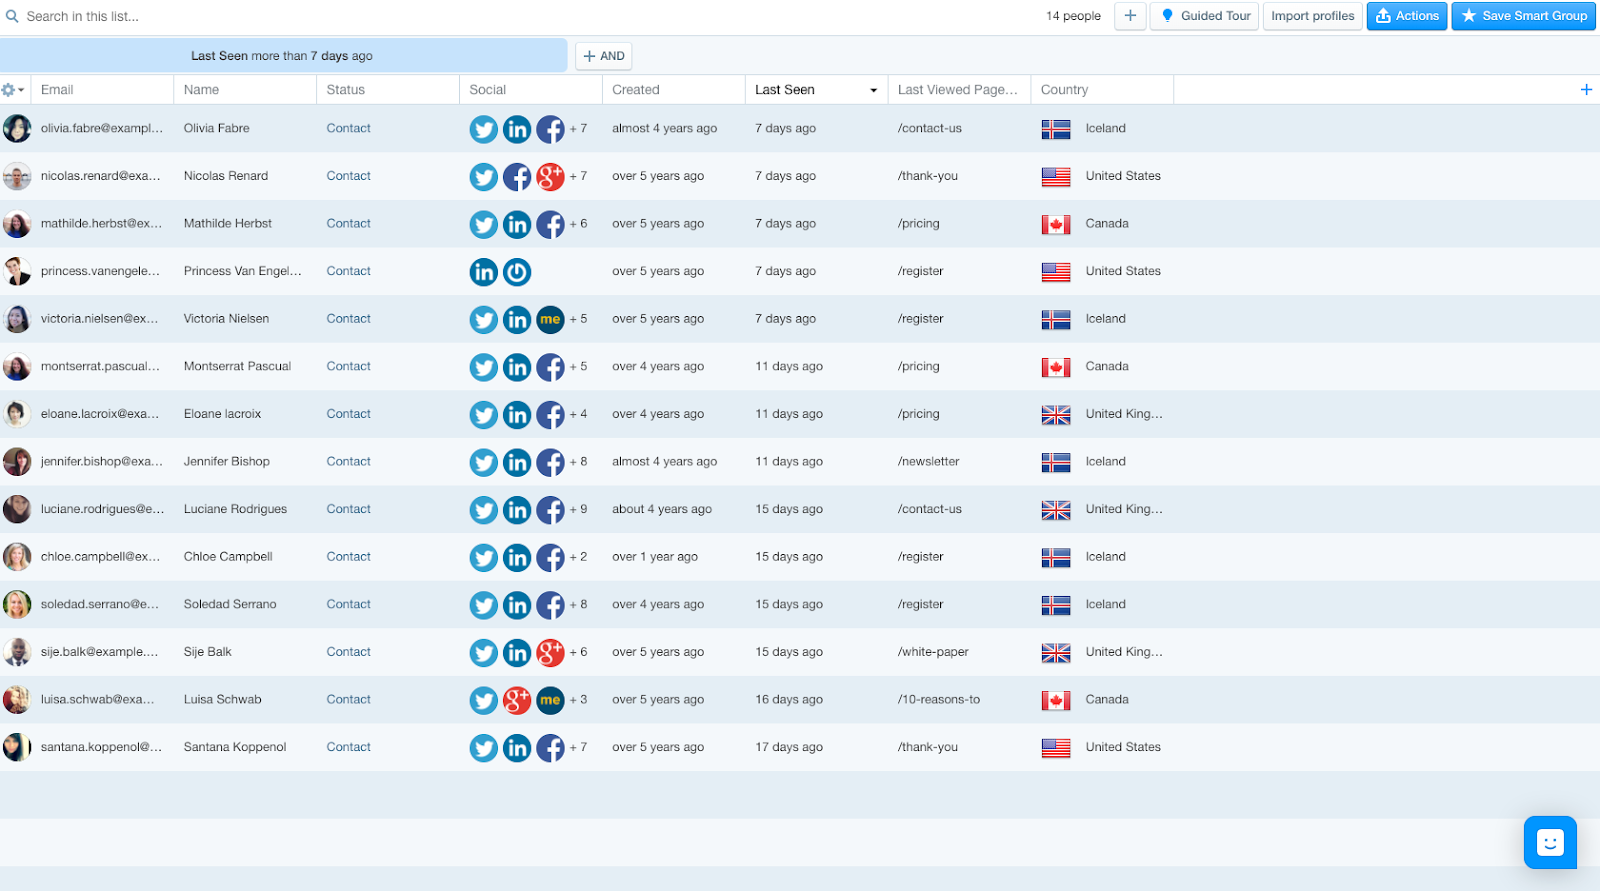
Inside of a customer analytics tool (such as GoSquared’s Customer Data Hub), you can review who has viewed your pricing page more than once. If this person has signed up for your service in the past and is no longer a customer, or if they have engaged with you via live chat, then you’re able to see their contact details. If not, you’ll just see anonymous data, which can still prove useful.
For people who have visited the pricing page more than once, you can review…
- When they were last seen on your site
- What page they visited last
- Whether they are a contact or a current customer
- Their name, email and social profiles
- Their country

Take action on this opportunity – drive more new customers
When you know who your hottest leads are, what do you do next? The answer depends in part on what resources you have (sales, customer success) and the average customer lifetime value (how much manual effort is worth the work). Here are a sampling of actions you can choose from:
- Manually reach out to share your top-downloaded resource
- Trigger a pop-up for an option to a pre-recorded demo or other webinar next time they are on the site
- Send an email offer with a 20% off coupon for the first 3 months, with an expiry date within 3 – 7 days from the email being sent (20% or whatever number you want. You can make it match your annual pricing discount, essentially giving them an annual pricing deal temporarily, but not requiring that they sign up for annual)
- Review top viewed pages for anonymous users who viewed the pricing page more than once, so you can prioritize these pages for your CRO efforts.
Depending on your product and price point, you can verify company size based on the email domains captured and filter by country as well, if you only target certain regions.
Finding out who is likely to churn

55% of SaaS companies rate customer retention cost as the key metric to measure. Your best potential customers are your current customers.
For many companies, the cost of customer acquisition necessitates a two or three-month subscription just to break even.
And when it comes to free trial subscribers, those folks are incredibly valuable. You worked hard to get them in the door. You brought in targeted blog traffic and you improved your website conversions. It can be incredibly tempting to keep focusing on acquisition and bringing more people into your free trial, but if you’re not optimising the free trial experience, you’re in big trouble.
Improving your free trial requires:
- Amazing onboarding emails
- Walkthroughs and product tours that result in user activation
- Continued testing to validate or disprove the Aha Moment and help users reach it quicker
You can find revenue-generating opportunities regardless of how optimised (or terrible) your user onboarding currently is.
When using GoSquared, you can capture the email address and social media profiles of your free trial users and review who hasn’t logged in for a period of time. We recommend filtering out for 7 days to determine which free trial subscribers haven’t logged in for 7 days or more.
Take action on this opportunity – slash your churn in half
Great, so now you know who hasn’t been logging in. These people haven’t been using your product, which means they likely didn’t reach the Aha moment or the timing has been bad or maybe they’re just not your ideal customer. Let’s not assume that they’re not a fit at this point, and instead assume that they’ve simply been too busy to explore your product or that your onboarding hasn’t proved helpful to them. There are several things you can do to get them logging back in:
- Have a customer success rep email them personally and offer a 10-minute onboarding session
- Send them a personalised BombBomb video letting them know resources are available to help them get started
- Offer an extension of their free trial
- Use Zapier to add them to a segmented user onboarding sequence in your email automation tool with content designated for unengaged free trial users
Depending on the product market, you could even engage with them on social media by commenting on one of their posts or welcoming them as a new user.
Trends: top devices and top countries

Of course, you’ve reviewed your website analytics to determine your top devices and countries before, haven’t you?
Everyone does this. Login, take a look. Nod and think “wow, cool.” Then log out.
Hmmm…that’s a fun habit and all, but it’s not going to impact your revenue. So how can you use this information to grow your revenue?
Once you know your top device types and countries by volume and percentage of the whole, it’s time to take action on it.

Take action on these opportunities – prioritise the experience
For device types:
If your web traffic is equally mobile and desktop, then you know you need to prioritise having an incredible experience across both devices. If you find that traffic from tablets has gone up sharply in the previous year or quarter, then you may want to manually test the experience across multiple brands and sizes of tablets.
Many websites today load the full version of their site on tablet (instead of a mobile version) and it can be really challenging to click around in small menu titles, and especially menu drop downs. Those often misfire in tablets.
For top countries:
Most likely, your top country will be the one you expect. It will be where your company is located, or your target market. However, you absolutely can find a revenue-generating opportunity in this data. What if a new market is showing a big desire for your solution? Maybe there’s a country that you hadn’t thought of targeting that is making up 10% or even 20% of your total traffic.
If you discover such a country, you should first attempt to figure out where the traffic is coming from. Did you get regional press coverage? Do you have a power user who is an advocate for your product or is one of your top affiliates located there? Before you start throwing ad money at a new region, figure out how you can maximize any existing organic success.
Important pages with low average time on page

Average read time can be depressingly low. If you have content pieces that average 10 seconds of read time, that’s a clear indicator that the content isn’t engaging to the audience, or not reaching the right audience. But what about important website pages like your homepage, your product page and your pricing page?
Low average time-on-page, say 20 seconds or less, can show the same thing. Either the page isn’t being seen by the people who would care to read it, or it isn’t grabbing their attention. If you have a low amount of traffic, have just launched, or have low average read times across every page, there’s a chance that the problem is due to getting the wrong traffic. But most likely, the culprit is that the content itself is not engaging for your ideal customer.

Take action on these opportunities – optimise for read time
For important sales-focused pages with low average read time, you should optimise for read time as your North Star Metric, before attempting to optimise for conversions.
Why? Prospects can’t buy from you if you can’t get their attention. Set a benchmark for the average read time over the time period of one to three months. Then make incremental changes to the page, and review the results.
- Illustrate the problem better. In SaaS especially (where the focus is too often on the features), many marketers often lack old-school storytelling prowess. Paint the problem your ideal customers face, and make it awful. Use adjectives and anecdotes from customer research.
- Rewrite the hook in the hero. Try starting the page with a hook that illustrates the problem and pulls the reader in, or have an outcomes-focused hero that is more emotional than what you have currently.
- Put your best customer front and centre. Do you have a well-known customer that would add instant authority? Instead of just a testimonial at the bottom of your site, try and get a high-quality photo approved alongside it for your header, or work towards a case video when possible.
Discovering your sales pages with low read times and turning the lever on that metric will increase engagement with your brand and provide a starting point for conversion optimization.
We all know that data is important. But what really matters is what you do with it. So don’t just login into your SaaS website metrics dashboard. Take action.
If you want to bring the data on your SaaS users and customers together in one place, learn more about GoSquared Analytics and the Customer Data Hub. Try it totally free for 14 days, no credit card required..